Before/After: From Dense Dashboard to Story-First Analytics at MerchantWave
Design · 6 min read
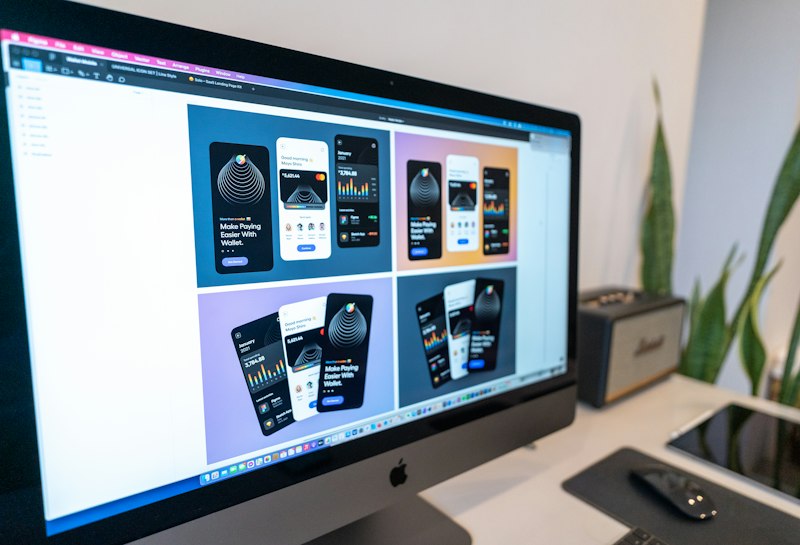
MerchantWave's legacy dashboard presented dozens of widgets on a single canvas, leaving new users overwhelmed and power users frustrated by noise. The product team reframed the problem as a storytelling exercise: what decisions do merchants need to make daily, and what data supports those decisions?
The after view organized information into a top-level narrative: Today, What Changed, and Next Actions. Each section contained compact visualizations with contextual one-liners and suggested tasks, like promoting a product with rising demand or adjusting inventory for a predicted shortage.
Adoption metrics improved; feature usage for the recommendations pane increased by 60% and average time to insight (measured as time from login to first action) fell by 35%. Merchants reported the dashboard felt more strategic and less like a data dump.
MerchantWave's process emphasizes research-driven prioritization: interviews to capture decision workflows, metric mapping to reduce scope, and iterative prototypes. The result is a dashboard that guides decisions rather than just displaying numbers.